Create the sunburst plot.
draw_sunburst_plot.RdCreate the sunburst plot.
Arguments
- .dat
A data frame (or tibble) for the plot with specific requirements. Use the
get_sunplot_dataset()to generate this dataset.- .label_txt_size
A numeric value with the size of the text labels.
- .linewidth
Line width of the segments.
- ...
Passed to
ggplot2::scale_fill_brewer()allowing to change plot colours.
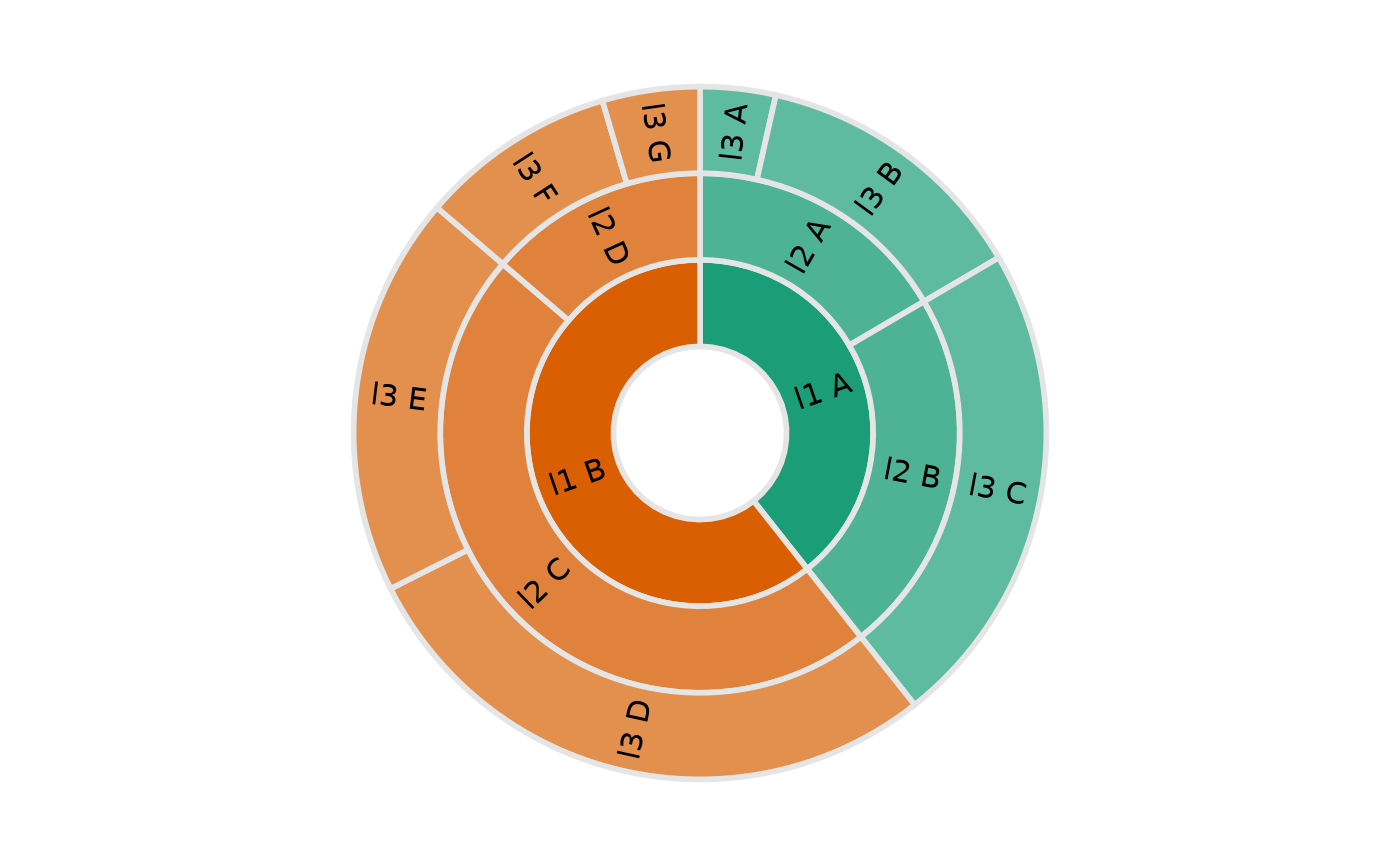
Examples
in_dat <- tibble::tibble(
level1_var = c(
rep("l1 A", times = 3),
rep("l1 B", times = 4)
),
level2_var = c(
"l2 A", "l2 A", "l2 B",
"l2 C", "l2 C", "l2 D", "l2 D"
),
level3_var = c(
"l3 A", "l3 B", "l3 C",
"l3 D", "l3 E", "l3 F", "l3 G"
),
values_var = c(
123, 456, 798,
987, 654, 321, 159
)
)

plot_dat <- get_sunplot_dataset(
.dat = in_dat,
level1_var, level2_var, level3_var,
.count_var = values_var
)

draw_sunburst_plot(
.dat = plot_dat,
.label_txt_size = 4,
palette = "Dark2"
)
#> Warning: Removed 1 rows containing missing values (`geom_text()`).